Service reports
If you use SentiOne React, proving that your online presence and service are effective, is just a few clicks. Monitor and verify the work of your team who are responsible for contact with customers on the internet. In your SentiOne React panel, you can define Service Level KPIs within the account, so you can analyse them within Service Reports module or Supervisor Panel.
Service Reports give you information such as number of threads, number of replies, number of threads divided by tags and statuses, average time of response, average time of waiting in queues, distribution of service level per source in time etc.
You can see the performance statistics of specific users or the whole team, specific projects and periods. Reports are generated as PDF files showcasing the analysis of your online activities.
How to generate Service Report?
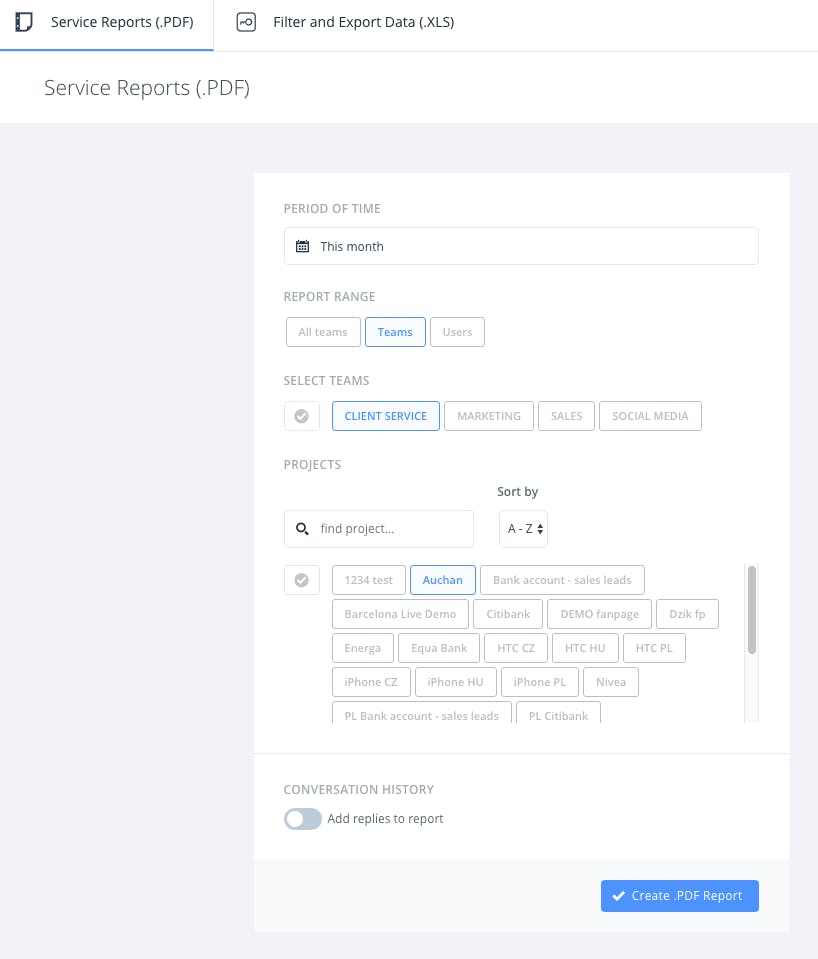
- Go to “Service reports” module.
- Decide for what period the report should be generated.
- Decide if you want to generate overall report, for specific team, or user.
- Decide if you want to include service for all projects or exclude some of them.
- You can also add sample replies to the report to make quantitative analysis for responses.

What does Service Report include?
Performance Report consist of sections where specific metrics are provided:
- Summary
- Response rate
- Statuses
- Projects
- Service Times
- Service Level
- Other
Summary
- Number of assigned threads per source
- Number of closed threads per source
- Number of ignored threads per source
- Number of all replies from the system per source
- Response rate (percentage of addressed threads per source)
Statuses
Statuses - assigned threads (number of threads per status: success, failure, pause - in routing, other)
Projects
- Number of assigned threads (assigned threads per project)
- Number of finished threads (closed threads per project)
Service Times
- Average queue time (from assigning to the team to assigning to specific user)
- Average reply time (from assigning to the user to first reply)
- Average service time (from assigning to the user to closing the thread)
- Average lifetime (from indexing the thread in our system to closing it)
Service level
- Service level - percentage of threads managed as per service level (example: 94% of the threads from Facebook have been served in expected time).
- Service level charts per source (Facebook, Twitter, Instagram, Blogs/forums, other).
Other
- Number of closed threads in time
- Histogram: New vs Closed Threads (Average) - how many threads have appeared / have been closed in specific time (it is the average time for every single hour based on period of time analysed in the report)
If global report is generated (not for specific team) some additional metrics per teams are added:
- Number of threads assigned to specific team
- Number of threads ignored in specific team
- Number of threads re-assigned (assigned to other teams)
- Number of threads closed in specific team
- Average service time (time from assignment to closing)
It is also possible to add user’s replies to the report (there will be only replies published by a specific user via SentiOne React).
Can I export data as .XLS file?
Data export is the additional part of reports. This is an excel file with information about the history of every thread. It's called Events export. An Event is every action which a user executes supporting the thread: assigning, replying, tagging, etc. Please note that .XLS based functionality is additional feature of enterprise offer and it is not included in Performance Reports by default. Contact us to learn more.
How to set Service Level KPIs for company?
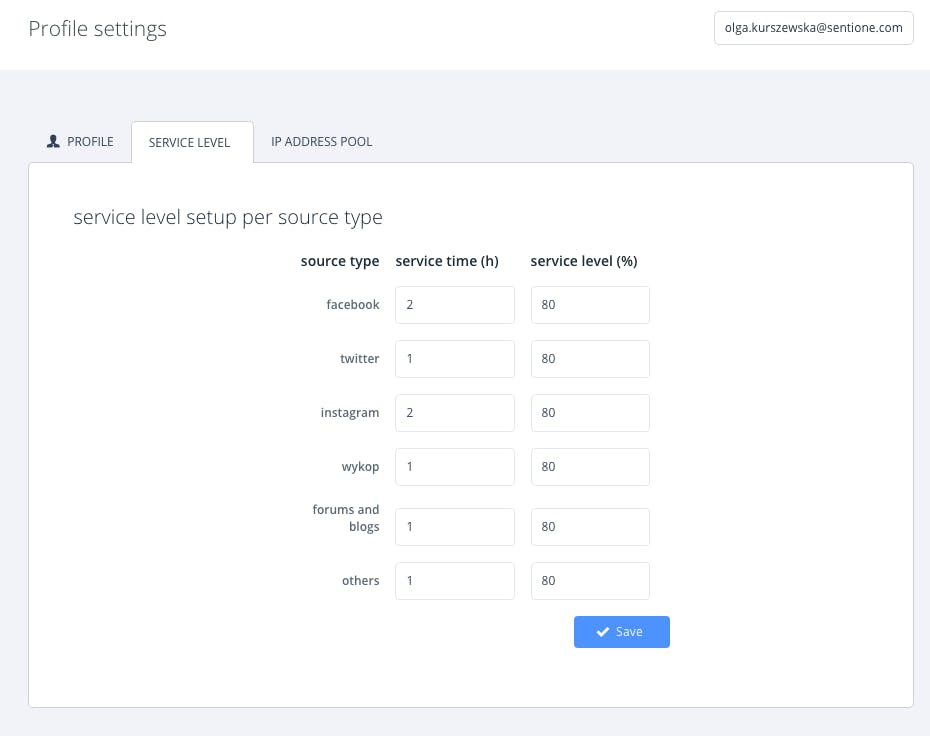
SentiOne React makes it possible to define Service Level KPIs, so you can see within Service Reports module or Supervisor Panel whether your team meets expected goals.
According to your customer service KPIs, you can set up the service level for specific sources. For example, a client with settings as seen (screenshot below), expects that minimum 80% of all threads from all sources will be managed within 24 hours. Information about SL (service level) is available in Service Reports and Supervisor Panel.
The set-up functionality is available in user preferences view. Only administrators of companies with access to this functionality can see and manage it.

Updated 10 months ago
